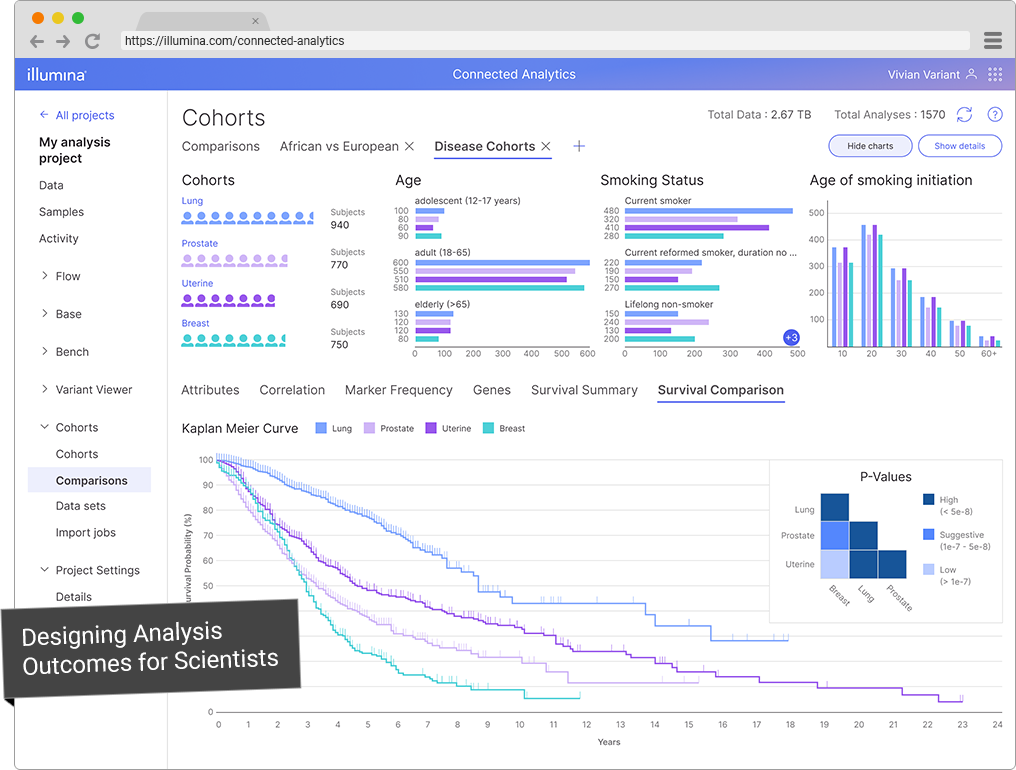
Cohorts, by Illumina Connected Analytics, lets customers aggregate and analyze genomic and clinical data using private, public and partner data sets, and then compare groups of subjects to accelerate biomarker and drug discovery.
Personas
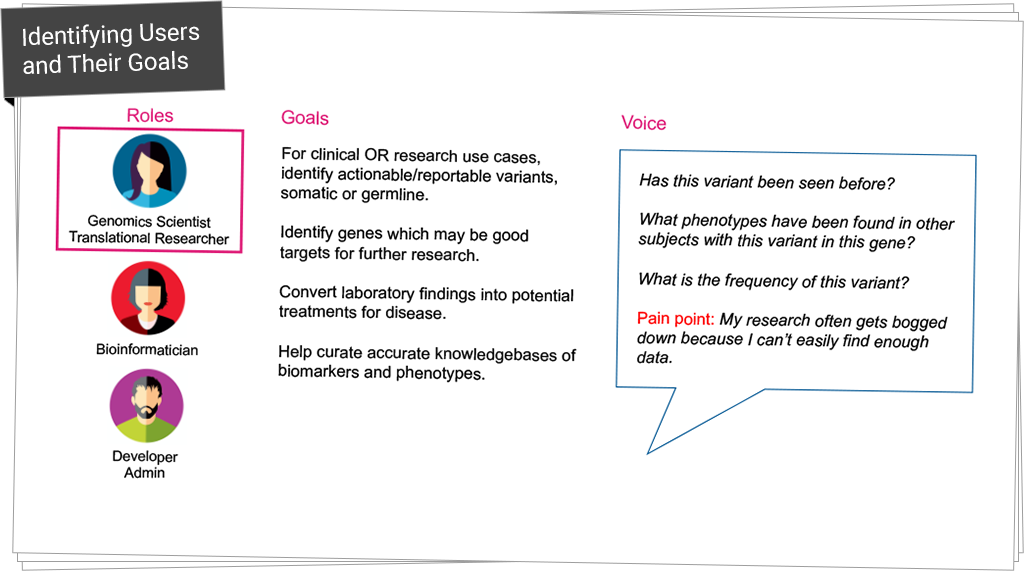
As Senior Staff Interaction Designer at Illumina, I created personas based on interviews with stakeholders and subject matter experts. These evidence-based personas were used to identify user behaviors, tasks, and workflows. The key persona is the research scientist who’s goal is to discover biomarkers of interest for pharmaceutical or clinical cures.
Card Sorting
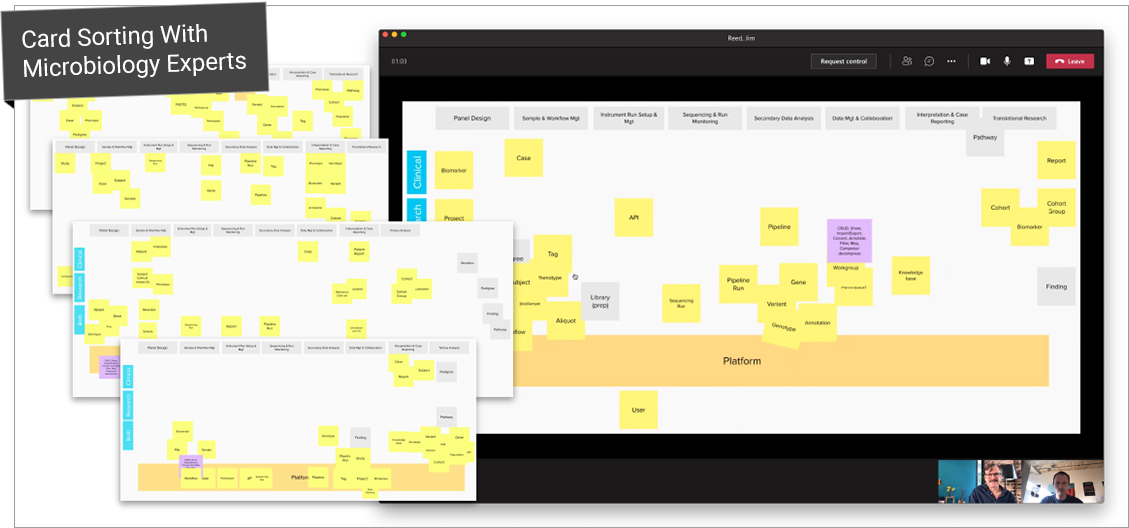
The discovery phase is one of my favorite parts of the design process. I collaborated with UX researchers and conducted a series of card sorting activities with subject matter experts and stakeholders to better understand the terminology and mental models for analyzing genomic data.
User Interviews
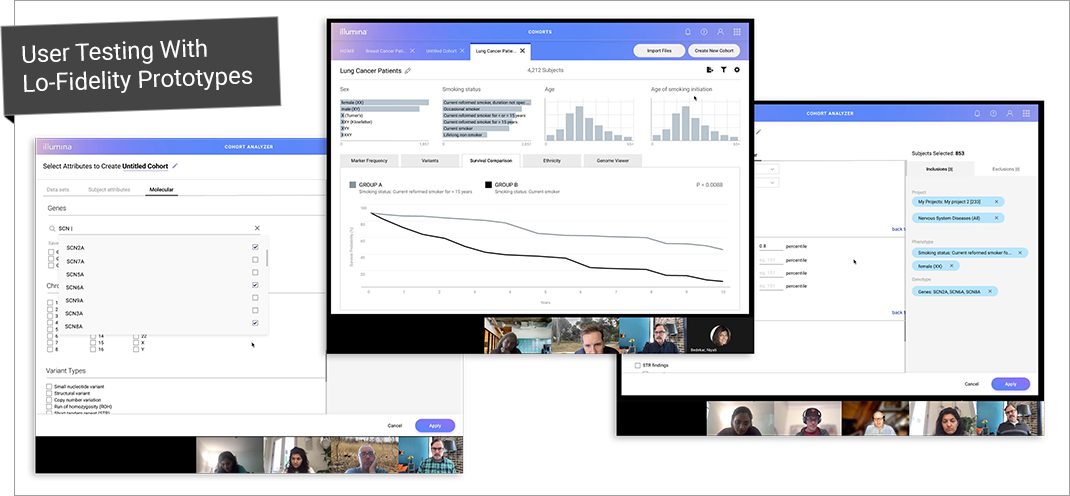
Early low-fidelity conceptual designs helped identify interaction models, and user interviews helped validate the concepts. I conducted several user interviews with bioinformaticians currently using digital workflows to evaluate genetic variants.
Storyboards
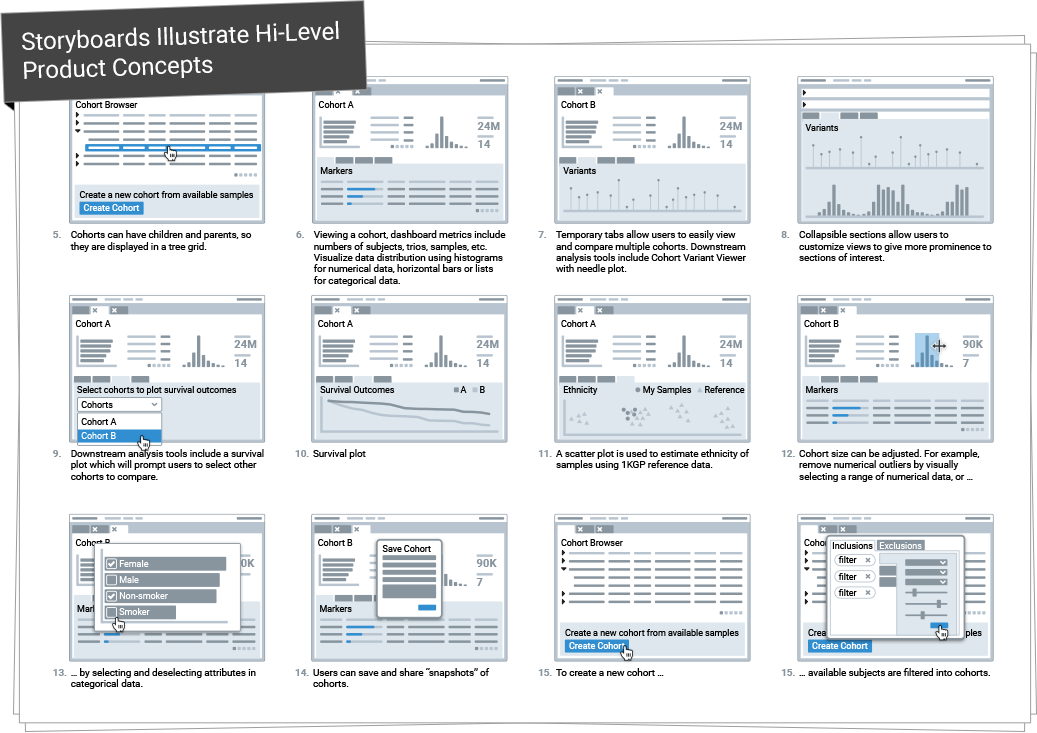
Storyboards help communicate to product stakeholders the high-level design of the user workflows and interaction models.
Prototypes
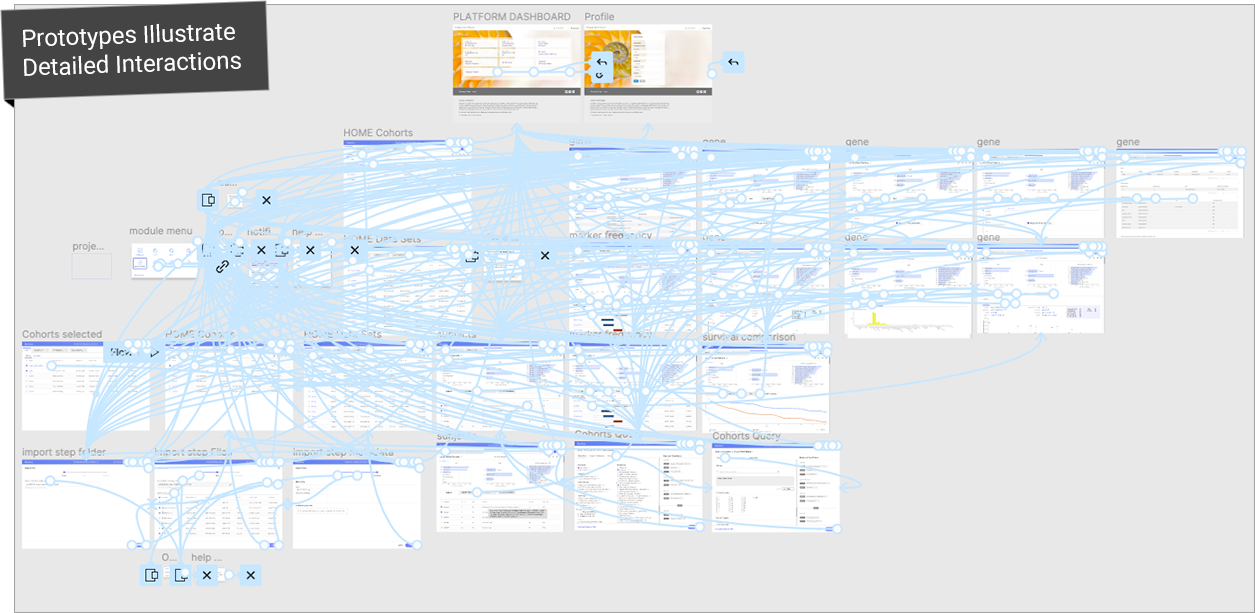
Prototypes are invaluable UX tools for communicating the experience design decisions to stakeholders and users. In this screenshot from Figma, the blue arrows, nicknamed “noodles", are the interactive connections within the prototype.
Enhancing the Experience
This end-to-end design journey included several user research studies and ongoing synthesis of customer feedback from scientific users in the field.
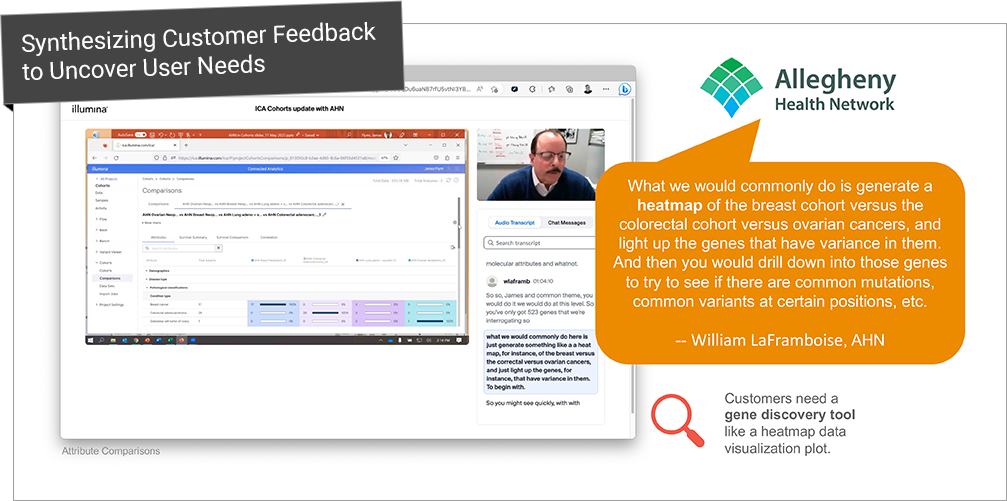
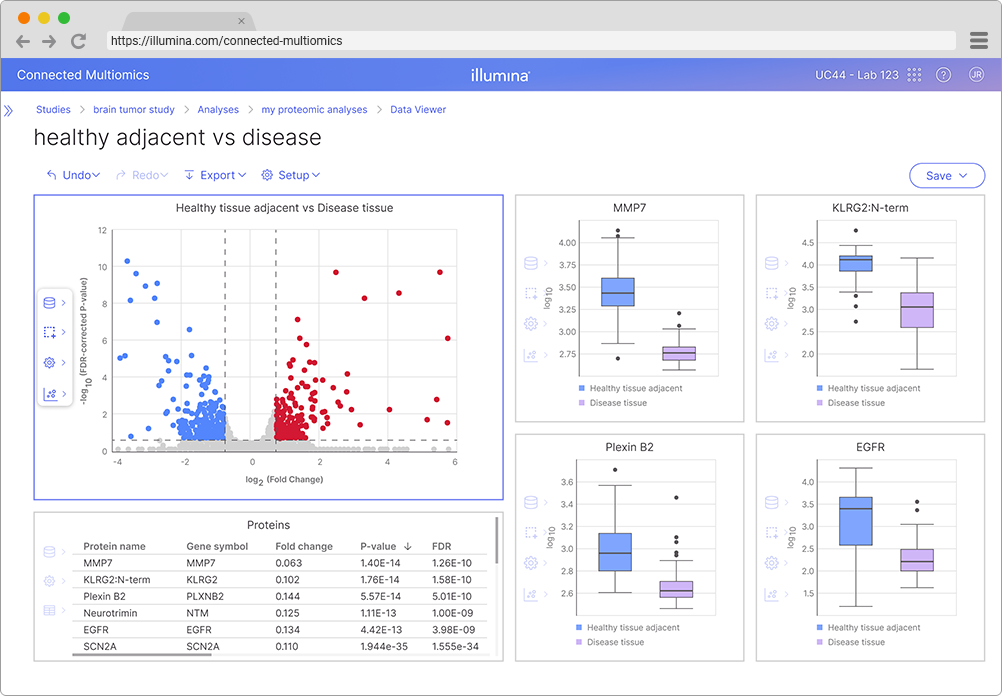
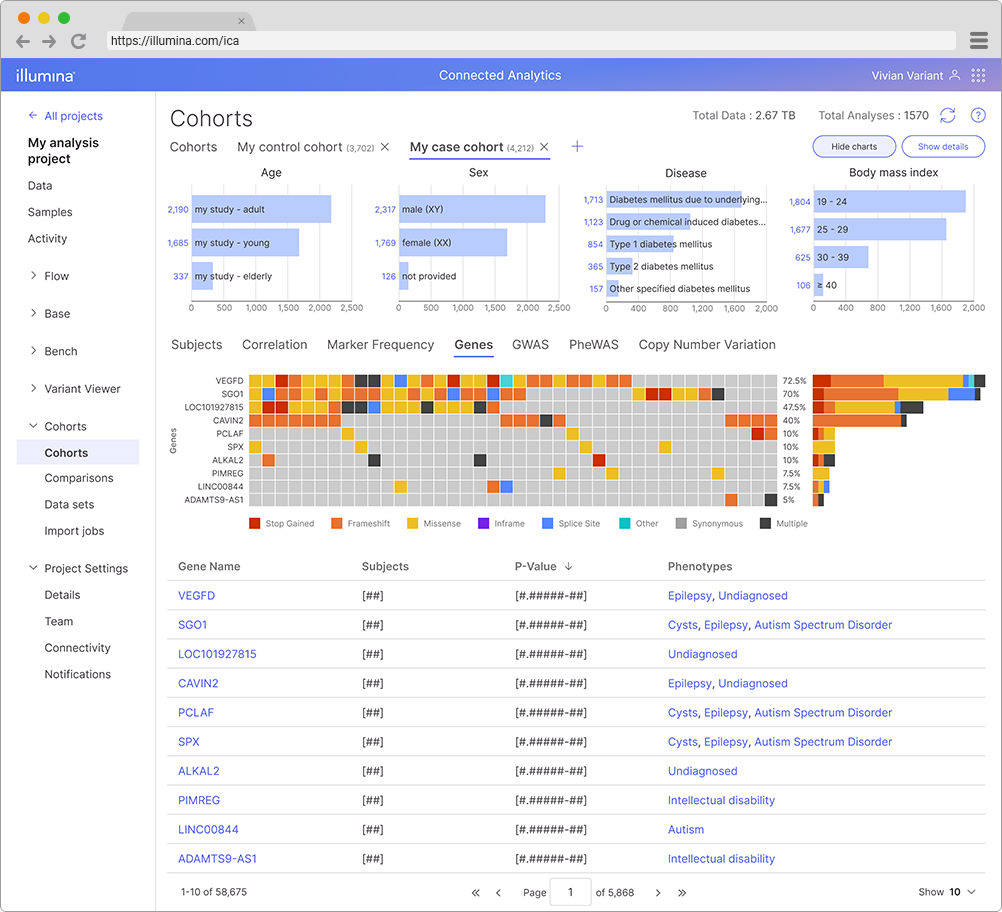
In this example, I used direct customer feedback to uncover an unmet user need to discover genes that are relevant to their scientific studies. My resulting mockups specified new user-centered features such as a comparison heat map.
User-Centered Design
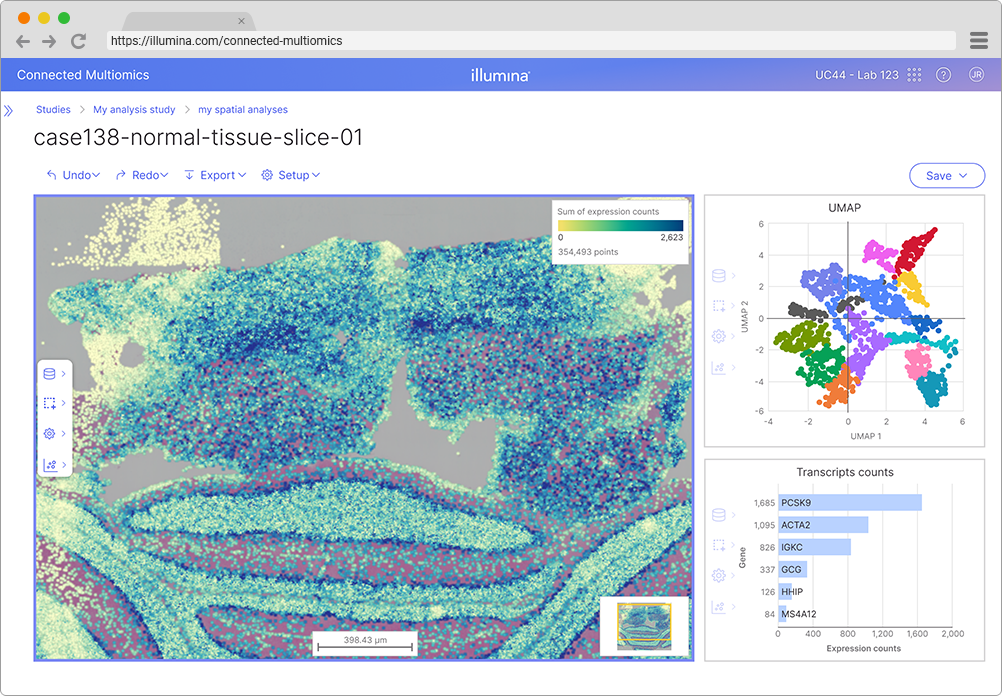
I use insights from user testing to identify incremental product improvements. For example, allowing users to customize a data visualization plot based on their research needs.
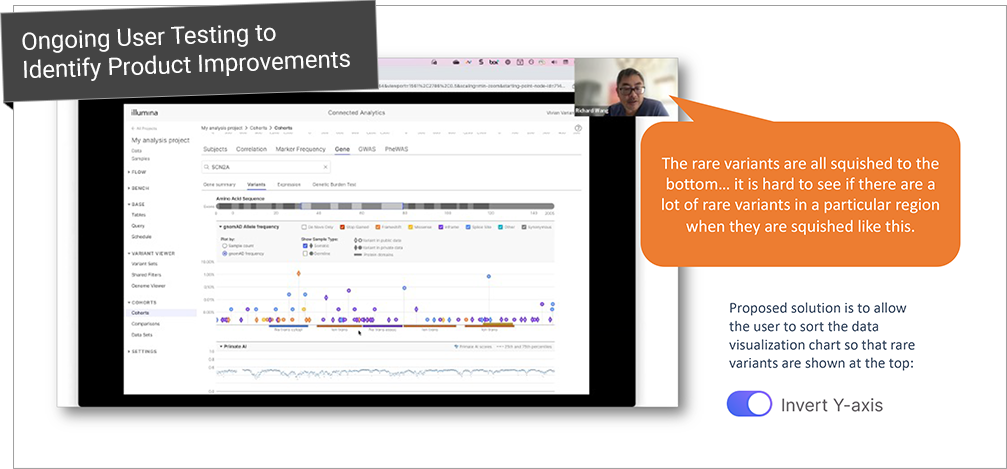

User testing also uncovered unmet user needs to view the distribution of variants by type, and since there were several types to measure per gene, the radar charts were an appropriate and intuitive data visualization.
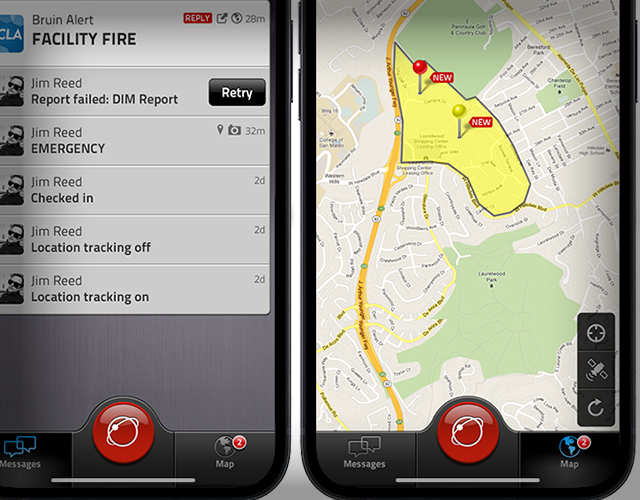
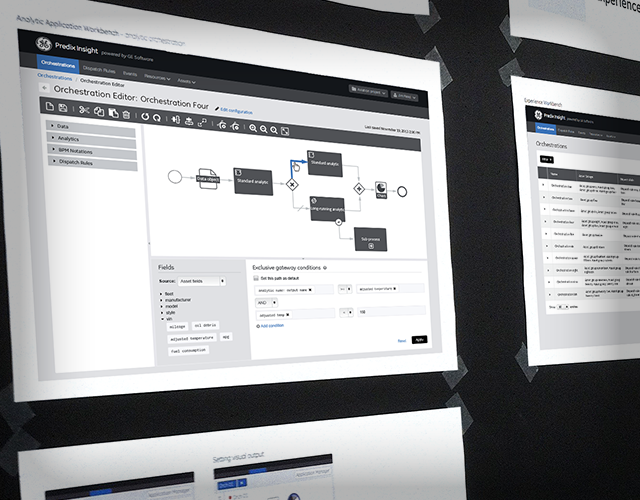
Cross-Product Design
I applied the visual design language and interaction patterns to related apps to ensure that the platform of products have a cohesive look and feel.